

Deep learning has a vast application in medicine. In this post, we want to talk about detecting COVID-19 from chest CT scan. Although we are deeply hopeful that this outbreak ends soon, due to vaccinating, This task can be used in the future for diagnosing other lesions caused by different viruses.
First, let's take a look at the imaging features of the COVID-19 infection:
The most common abnormality is ground-glass opacity (GGO) in which, some areas in lungs CT scan looks hazy gray, while the normal lungs appear black and blood vessels look white. When the infection progresses, the lesions turn into white consolidation because of the accumulation of more fluid in the lungs. The most severe abnormality is crazy paving" pattern which refers to the appearance of ground-glass opacities with superimposed interlobular septal thickening and intralobular septal thickening [1] . Figure depits these patterns. The figure below shows these tree lesions:
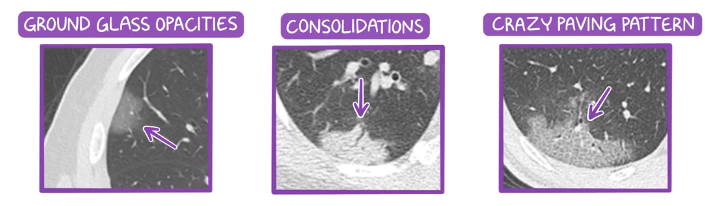 [2] different typs of lesions
Although CT scan is very sensitive to these finding, we should consider that they are not specific to COVID-19 and can be seen in other viral diseases such as influenza and adenovirus.
In deep learning domain, several tasks have been defined in this respect, including classification and segmentation.
Classification task can be considered as 2 or 3-classes’ problem. In 2-classes classification, the objective is to classify normal cases from infected ones. In 3-class classification, the classes are chest normal, COVID-19, and Pneumonia.
Segmentation can be used to segment lung or infection. Lung segmentation is a preprocessing step for classification or segmentation tasks, by which the generalization is improved as different CT scans in different datasets can have various backgrounds. Furthermore, the deep models attention is drawn to lungs only to extract features.
In infection segmentation, the goal is to segment infected tissue in CTscan images. Therefore, the percentage of infection and then Disease progression can be diagnosed.
Deep models are data-driven, so surveying datasets seems essential. The common file formats in chest CT scan datasets are:
• DICOM
• NIfTI
• png/ gpg/tiff
All of us are familiar to png/ jpg and tiff files. Let’s investigate other file formats:
Digital Imaging and Communications in Medicine (DICOM) is a worldwide standard for the storage and transmission of medical imaging. The standard, therefore, defines both a file format and a networking protocol. [3]. The file extension of DICOM is '.dcm'.
NIfTI is a type of file format for neuroimaging. NIfTI files are used very commonly in imaging informatics for neuroscience and even neuroradiology research. In clinical care DICOM files are standard.[4]. The file extension of NIfTI files is '.nii'. NIfTI files are 3 dimensional and include all the slices of the CT scan of one patient.
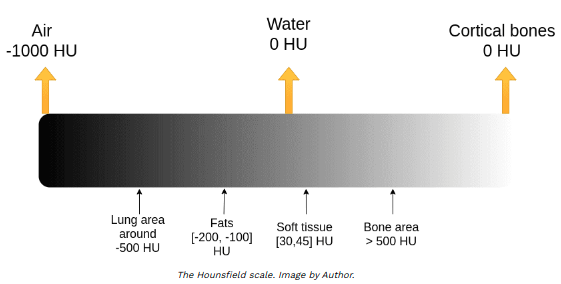
Both DICOM pixels and NIfTI voxels are in range -1000 to above 2000 measured in Hounsfield scale. The Hounsfield unit (HU) scale is a linear transformation of the original linear attenuation coefficient measurement into one in which:
• distilled water = 0 HU
• air = -1000 HU
 [5]
[5]
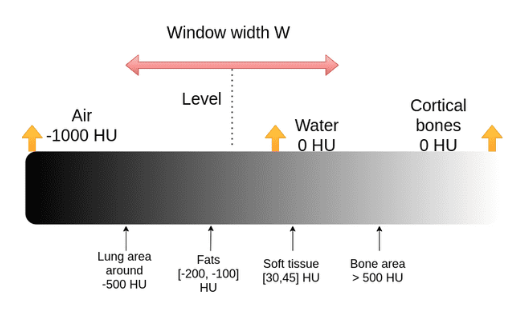
The DICOM and NIfTI files have a wide range from -1000 to above 3000. For COVID classification task, all of these values are not informative.
The process of selecting the interested range is called windowing. Two windows including mediastinum and lungs are standard windows for chest CT scan. To choose an interested range a center and a window width are defined.
• lungs W:1500 C:-600
• mediastinum W:350 C:50
Where C is window center and W is window width.
Therefore, the maximum and minimum values can be calculated as:
[5]
These values can be a bit different for various CT scan machines. By mapping the range into [0, 255] these windows can be visualized.
To read DICOM and NIfTI files several libraries in python are available:
• DICOM: pydicom, medpy, ...
• NIfTI: nibabel
As the process is very similar, we only depict the snippet belongs to DICOM files.
• First we read the data (DICOM):
from medpy.io import load

def dicom2png(source_ file):

image_2d, image_header = load(source_file)

dicom2png(path_to_source file)
• We initialize the window center and window width and omit unnecessary data:
level = -600 # for lung

window = 1200 # for lung
level = 50 # for mediastinum

window = 350 # for mediastinum
max = level + window/2

min = level - window/2

image_2d[image_2d < min] = min

image_2d[image_2d > max] = max
• Now let’s mapping the interested range to [0, 255] to visualize the windows:
import png

import numpy as np
image_2d = image_2d.astype("float32")

maxx = image_2d.max()

minn = image_2d.min()

image_2d_scaled = ((image_2d - minn) / (maxx - minn)) * 255.0

image_2d_scaled = np.uint8(image_2d_scaled)

file2w = image_2d_scaled.copy()
with open(path_to_output_file+'.png', 'wb') as png_file:

w = png.Writer(512, 512, greyscale=True)

w.write(png_file, file2w)

img = cv2.imread(path_to_output_file+'.png')

cv2.imshow('window', img)
cv2.waitKey()

cv2.destroyAllWindows()
Now the data is appropriate for feeding into deep models.
The classification models can be divided into 2D and 3D models which take DICOM or png and NIfTI files respectively. In the next post, we will discuss different models more. Moreover we will discuss converting different formats to each other.
[1] https://radiopaedia.org/articles/crazy-paving
[2] https://www.osmosis.org/learn/Imaging_features_of_COVID-19_(LifeBridge_Health)
[3] https://radiopaedia.org/articles/digital-imaging-and-communications-in-medicine-dicom?lang=us
[4] https://radiopaedia.org/articles/nifti-file-format
[5] https://www.osmosis.org/learn/Imaging_features_of_COVID-19_(LifeBridge_Health)
Send Comment